Cartographie des zones inondables par approche hydrogéomorphologique/en : Différence entre versions
(→Méthode d'analyse) |
(→Hydrogeomorphological mapping) |
||
| (72 révisions intermédiaires par 2 utilisateurs sont masquées) | |||
| Ligne 4 : | Ligne 4 : | ||
= Introduction = | = Introduction = | ||
| − | Since the publication of the [http://catalogue.prim.net/147_cartographie-des-zones-inondables-approche-hydrogeomophologique.html methodology guide in 1996], the method of mapping of floodplains using | + | Since the publication of the [http://catalogue.prim.net/147_cartographie-des-zones-inondables-approche-hydrogeomophologique.html methodology guide in 1996], the method of mapping of floodplains using hydrogeomorphological approch has been essential to the creation of flood-plain Atlas and the Flood Hazard PPR maps. It has been used in projects concerning land use and development (PLU, SCOT ...). |
| − | This method allows for a good understanding of the natural and man-made | + | This method allows for a good understanding of the natural and man-made elements of the valleys landscape, of the different parts of the alluvial plains and of the hydrodynamics of the streams. Its precision has been proved to be effective during the exceptional floods in the Aude in November 1999, the Gard during September 2002 and the Var in June 2010.<br> |
= Scientific Basis = | = Scientific Basis = | ||
| − | The | + | The hydrogeomorphological approach is a geomorphological analysis of the alluvial plains. |
Geomorphology is the science of describing and explaining continental and submarine landforms | Geomorphology is the science of describing and explaining continental and submarine landforms | ||
| − | By studying the formation of the landscape on a geological time-scale as well as the effects of climate change and the current | + | By studying the formation of the landscape on a geological time-scale as well as the effects of climate change and the current morphogenic processes. This science provides a basis for the global understanding of the evolution of landscapes on different time-scales and sizes; It enables, for every studied landscape, the creation of a model of its evolution taking into account its geological and climatic history. |
| − | + | ||
| − | + | ||
| + | During Quaternary, the current geological era which started 1,8 million years ago, the numerous climatic variations multiplied the amount of embankment and alluviation phases making the alluvial sediments stratify or slide into one another. The lowest terrace above the floodplain is most commonly ascribed to the Würm (80 000 BC to 10 000 BC), the last ice age before the Holocene, the present era, during which took shape the present alluvial plains studied with the hydrogeomorphological approach.<br> | ||
= Method of Analysis = | = Method of Analysis = | ||
| − | == | + | == Principe == |
| − | [[Image: | + | |
| − | + | [[Image:Flood_Plain2011.jpg|droite|thumb|450px|Flood plain, Ballais and al., 2011]] | |
| + | |||
| + | |||
| + | Essentially the method revolves around the analysis of : | ||
| − | * | + | *the physical shape of the valley and the basic theoretic model taking into account its evolution in space and time. |
| − | * | + | *Information relative to the historic floods |
| − | * | + | *Land-use |
| − | * | + | *The man-made structures likely to affect the rivers hydraulic functioning, especially during a flood. |
<br> | <br> | ||
| − | + | In order to make the model, it is necessary to divide the drainage basin into its most essential and important elements : | |
| − | * | + | *Geographic units reflecting the hydraulic functioning of the river in its different regimes : |
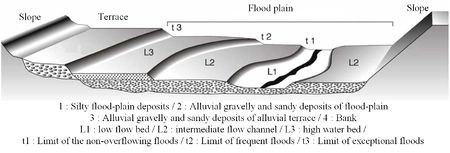
| − | - | + | - the river banks and alluvial terraces forming the enclosing bed |
| − | - | + | - the alluvial plain separated into low flow bed, intermediate flow channel and high water bed. |
| − | * | + | *Precise boundaries separating those units and enabling the mapping of them : the banks caused by the valleys erosion. |
| − | * | + | *Within the floodplain secondary morphological structures that can have a major impact on the water flow (natural or man-made channels, fluvial annexes, shape of the ground, geomorphological basin, .....) |
| − | <br> | + | <br>The floodplain is the area which can be flooded, the river leaves identifiable morphological traces on the valley allowing us to delineate the floodplain. The floodplain can be separated into zones according to the likelihood of a flood and the impact one would have (figure 1). |
| − | == <br> | + | == <br>Application == |
| − | + | This type of study makes use of: :<br> | |
| + | *Existing documents<br> | ||
| + | *Scientific Maps : geological maps, geomorphological maps and possibly pedological maps.<br> | ||
| + | *Topographic maps : IGN has maps of France at a 1/10 000 scale<br> | ||
| + | *The photographic interpretation of air photos, often multiple sets of pictures enables can be very interesting ( more precise or evolution over a period) A specialist might be required in difficult situations.<br> | ||
| + | *Field work : observations are necessary to verify and complete the information obtained with the air photos (ex: in case of dense foliage) . It is possibles to find traces of the previous floods and get information from the locals.<br> | ||
| − | + | <br>Hydrogeomorphological mapping = | |
| − | + | [[File:Pertuis.jpg|droite|thumb|150px|hydrogeomorphological mapping in Pertuis (France)]] | |
| − | + | After the phase of analysis and interpretation a map can be made. It is usually 1/10 000 or 1/25 000 on a SCAN 25. | |
| + | This map will display: | ||
| + | *The basic structure: the relief delineating the alluvial plain and the hydrographic network | ||
| + | *An interpretation of the hydrogeomorphological units: | ||
| − | + | - external limit of flood-plain<br> | |
| + | - low flow bed, intermediate flow channel and high water bed. | ||
| − | + | The factors with an impact on hydrodynamics will be on the map. | |
| − | + | ||
| − | + | Some structural elements of the effective alluvial plain may be shrouded or hidden for a multitude of reasons (urbanization, agriculture ...) The components of the alluvial system will be represented very precisely on the map after having been verified on the field. The elevation af geographic units will be specified as well. In case the boundary between two units is uncertain or gradual it will be represented by a dotted line.<br><br> | |
| + | <br /> | ||
| + | <br /> | ||
| + | <br /> | ||
| − | + | = Comparison between theoric results and historic floods = | |
| − | + | == The historic floods == | |
| + | [[Image:FranceDep.jpg|droite|thumb|80px|Observed floods]] | ||
| + | Three rivers in the south of France can be studied to compare the actual flood and the prediction made using the hydrogeomorphological approach : | ||
| − | + | *November 1999 int the Aude Department, | |
| + | *September 2002 in the Gard Department, | ||
| + | *June 2010 in the Var Department. | ||
| − | == | + | == The method == |
| + | [[Image:Excess_polygon.jpg|gauche|thumb|180px|Excess Polygon]]<br> | ||
| − | + | This numerical method comes from three publications (one by Chave in 2002 and two by Esposito in 2003 and 2011). The basic numeric data is a vector layer which can be assimilated with multiple straight lines. When the flooded zone exceeds the predicted floodplain it is represented by an excess polygon. It is possible to delineate all of those and calculate their surface using the MapInfo program. After that the program shall determine the “LINEAIRE” : the length of the line of contact between the excess polygon and the predicted floodplain. The magnitude of the excess flooding still has to be characterised; it is defined as such : If you were to assimilate the polygon with a rectangle of equal surface and having the linear as a side.<br> | |
| − | + | S: surface of the polygon<br> | |
| − | + | Lc : length of the Linear<br> | |
| − | * | + | Am: average Magnitude<br> |
| + | Eg : hydrogeomorphological Envelope<br> | ||
| + | S = Lc*Am<br> | ||
| + | 1 : Flood-risk area<br> | ||
| + | 2 : Flooded area<br> | ||
| − | + | The, numeric, threshold above which an Am can be considered significant can be defines as the sum of all imprecisions, starting with the imperfections of the field data, the interpretation and the approximation into polygons. If the average magnitude of the excess flooding if superior to this threshold we shall consider the polygon to hold some interesting interesting information. After analysing all the steps to making this map, this threshold was fixed at 25m | |
| + | <br> | ||
| + | <br> | ||
| − | + | == Result == | |
| − | + | [[Image:Excess_average.jpg|gauche|thumb|250px|Excess Polygon in Gard (1) and Aude (2) department]] | |
| − | [[Image: | + | |
| − | <br> | + | [[Image:ExcessLinear.jpg|droite|thumb|220px|Percentage of Excess Linear]] |
| − | + | ||
| − | <br> | + | <br> Concerning the historic floods in the Aude and the Gard, the graphic processing of the 27 streams predicted the waters propagation. This has been deduced from the values of the excess linear. In the Aude the excess linear was 12,5 % of the circumference of the predicted floodplain, 9% in the Gard. These excessive flooding are quite small since there were 51 in the Aude and 72 in the Gard, only 5% of those have an average magnitude superior to 60m so they are not very intense either. <br> |
| + | |||
| + | In the Var there were 21 excess polygons exceeding the hydrogeomorphologically determined floodplain. The cause for each excess has been determined. Five were due to “no HGM mapping of the tributary” which means the flooded zone/tributary hadn't been mapped and analysed. “Error in the mapping of the FZ” means the zone wasn't actually flooded in June 2010, “anthropological alteration” means the area was modified by men, causing the excess flooding. “error in the boundaries of the drainage basin” means the flooded area was outside of the major riverbed. | ||
| + | Having compared 305 km of theoretical boundaries with the 338 km limits of the actual flooded area we can see that out of 21 polygons : | ||
| + | 3 are due to “no HGM mapping of the tributary” | ||
| + | 15 are due to mapping errors, the mapping of the flooded zone and the prediction. | ||
| + | |||
| + | Out of 11311m of excess linear 84% are due to those mapping errors, 15% are due to an “error in the boundaries of the drainage basin” . | ||
| + | Thinking of the Atlas of Floodplains; the HGM boundaries were exceeded over 11 km. Considering the 300km initial boundary, 96% of the flood remained within the HGM delineation. | ||
== <br>Sources == | == <br>Sources == | ||
| + | *Ballais J.-L., Chave S., Dupont N., Masson E. et Penven M.-J., « [http://physio-geo.revues.org/3307 La méthode hydrogéomorphologique de détermination des zones inondables] », Physio-Géo, Volume 5 - 2011 - http://physio-geo.revues.org/3307 ; DOI : 10.4000/physio-geo.3307 | ||
*Chave S. (2002) - Contribution à la validation numérique de la cartographie hydrogéomorphologique, Géomorphologie, 4, pp. 297-306. | *Chave S. (2002) - Contribution à la validation numérique de la cartographie hydrogéomorphologique, Géomorphologie, 4, pp. 297-306. | ||
*Esposito C. (2011) - Crue du 15 juin 2010 dans le Var - Comparaison des limites des zones inondables et des zones inondées. Rapport 12/2011, CETE Méditerranée / DREAL PACA, | *Esposito C. (2011) - Crue du 15 juin 2010 dans le Var - Comparaison des limites des zones inondables et des zones inondées. Rapport 12/2011, CETE Méditerranée / DREAL PACA, | ||
| Ligne 97 : | Ligne 130 : | ||
<br> | <br> | ||
| − | |||
{{Auteur|NomAuteur=Christophe Esposito}} | {{Auteur|NomAuteur=Christophe Esposito}} | ||
| − | <br> | + | {{Auteur|NomAuteur=José-Luis Delgado}} |
| + | <br /> | ||
| + | <br /> | ||
Version actuelle en date du 2 juillet 2013 à 08:26
 Language: Language: |
Français • English |
Sommaire |
[modifier] Introduction
Since the publication of the methodology guide in 1996, the method of mapping of floodplains using hydrogeomorphological approch has been essential to the creation of flood-plain Atlas and the Flood Hazard PPR maps. It has been used in projects concerning land use and development (PLU, SCOT ...).
This method allows for a good understanding of the natural and man-made elements of the valleys landscape, of the different parts of the alluvial plains and of the hydrodynamics of the streams. Its precision has been proved to be effective during the exceptional floods in the Aude in November 1999, the Gard during September 2002 and the Var in June 2010.
[modifier] Scientific Basis
The hydrogeomorphological approach is a geomorphological analysis of the alluvial plains.
Geomorphology is the science of describing and explaining continental and submarine landforms
By studying the formation of the landscape on a geological time-scale as well as the effects of climate change and the current morphogenic processes. This science provides a basis for the global understanding of the evolution of landscapes on different time-scales and sizes; It enables, for every studied landscape, the creation of a model of its evolution taking into account its geological and climatic history.
During Quaternary, the current geological era which started 1,8 million years ago, the numerous climatic variations multiplied the amount of embankment and alluviation phases making the alluvial sediments stratify or slide into one another. The lowest terrace above the floodplain is most commonly ascribed to the Würm (80 000 BC to 10 000 BC), the last ice age before the Holocene, the present era, during which took shape the present alluvial plains studied with the hydrogeomorphological approach.
[modifier] Method of Analysis
[modifier] Principe
Essentially the method revolves around the analysis of :
- the physical shape of the valley and the basic theoretic model taking into account its evolution in space and time.
- Information relative to the historic floods
- Land-use
- The man-made structures likely to affect the rivers hydraulic functioning, especially during a flood.
In order to make the model, it is necessary to divide the drainage basin into its most essential and important elements :
- Geographic units reflecting the hydraulic functioning of the river in its different regimes :
- the river banks and alluvial terraces forming the enclosing bed
- the alluvial plain separated into low flow bed, intermediate flow channel and high water bed.
- Precise boundaries separating those units and enabling the mapping of them : the banks caused by the valleys erosion.
- Within the floodplain secondary morphological structures that can have a major impact on the water flow (natural or man-made channels, fluvial annexes, shape of the ground, geomorphological basin, .....)
The floodplain is the area which can be flooded, the river leaves identifiable morphological traces on the valley allowing us to delineate the floodplain. The floodplain can be separated into zones according to the likelihood of a flood and the impact one would have (figure 1).
[modifier]
Application
This type of study makes use of: :
- Existing documents
- Scientific Maps : geological maps, geomorphological maps and possibly pedological maps.
- Topographic maps : IGN has maps of France at a 1/10 000 scale
- The photographic interpretation of air photos, often multiple sets of pictures enables can be very interesting ( more precise or evolution over a period) A specialist might be required in difficult situations.
- Field work : observations are necessary to verify and complete the information obtained with the air photos (ex: in case of dense foliage) . It is possibles to find traces of the previous floods and get information from the locals.
Hydrogeomorphological mapping =
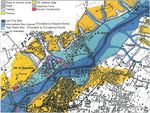
After the phase of analysis and interpretation a map can be made. It is usually 1/10 000 or 1/25 000 on a SCAN 25. This map will display:
- The basic structure: the relief delineating the alluvial plain and the hydrographic network
- An interpretation of the hydrogeomorphological units:
- external limit of flood-plain
- low flow bed, intermediate flow channel and high water bed.
The factors with an impact on hydrodynamics will be on the map.
Some structural elements of the effective alluvial plain may be shrouded or hidden for a multitude of reasons (urbanization, agriculture ...) The components of the alluvial system will be represented very precisely on the map after having been verified on the field. The elevation af geographic units will be specified as well. In case the boundary between two units is uncertain or gradual it will be represented by a dotted line.
[modifier] Comparison between theoric results and historic floods
[modifier] The historic floods
Three rivers in the south of France can be studied to compare the actual flood and the prediction made using the hydrogeomorphological approach :
- November 1999 int the Aude Department,
- September 2002 in the Gard Department,
- June 2010 in the Var Department.
[modifier] The method
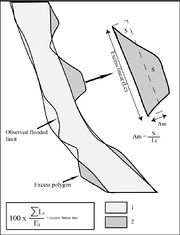
This numerical method comes from three publications (one by Chave in 2002 and two by Esposito in 2003 and 2011). The basic numeric data is a vector layer which can be assimilated with multiple straight lines. When the flooded zone exceeds the predicted floodplain it is represented by an excess polygon. It is possible to delineate all of those and calculate their surface using the MapInfo program. After that the program shall determine the “LINEAIRE” : the length of the line of contact between the excess polygon and the predicted floodplain. The magnitude of the excess flooding still has to be characterised; it is defined as such : If you were to assimilate the polygon with a rectangle of equal surface and having the linear as a side.
S: surface of the polygon
Lc : length of the Linear
Am: average Magnitude
Eg : hydrogeomorphological Envelope
S = Lc*Am
1 : Flood-risk area
2 : Flooded area
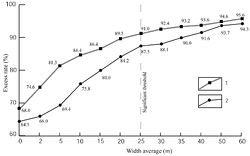
The, numeric, threshold above which an Am can be considered significant can be defines as the sum of all imprecisions, starting with the imperfections of the field data, the interpretation and the approximation into polygons. If the average magnitude of the excess flooding if superior to this threshold we shall consider the polygon to hold some interesting interesting information. After analysing all the steps to making this map, this threshold was fixed at 25m
[modifier] Result
Concerning the historic floods in the Aude and the Gard, the graphic processing of the 27 streams predicted the waters propagation. This has been deduced from the values of the excess linear. In the Aude the excess linear was 12,5 % of the circumference of the predicted floodplain, 9% in the Gard. These excessive flooding are quite small since there were 51 in the Aude and 72 in the Gard, only 5% of those have an average magnitude superior to 60m so they are not very intense either.
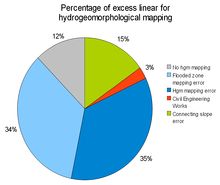
In the Var there were 21 excess polygons exceeding the hydrogeomorphologically determined floodplain. The cause for each excess has been determined. Five were due to “no HGM mapping of the tributary” which means the flooded zone/tributary hadn't been mapped and analysed. “Error in the mapping of the FZ” means the zone wasn't actually flooded in June 2010, “anthropological alteration” means the area was modified by men, causing the excess flooding. “error in the boundaries of the drainage basin” means the flooded area was outside of the major riverbed. Having compared 305 km of theoretical boundaries with the 338 km limits of the actual flooded area we can see that out of 21 polygons : 3 are due to “no HGM mapping of the tributary” 15 are due to mapping errors, the mapping of the flooded zone and the prediction.
Out of 11311m of excess linear 84% are due to those mapping errors, 15% are due to an “error in the boundaries of the drainage basin” . Thinking of the Atlas of Floodplains; the HGM boundaries were exceeded over 11 km. Considering the 300km initial boundary, 96% of the flood remained within the HGM delineation.
[modifier]
Sources
- Ballais J.-L., Chave S., Dupont N., Masson E. et Penven M.-J., « La méthode hydrogéomorphologique de détermination des zones inondables », Physio-Géo, Volume 5 - 2011 - http://physio-geo.revues.org/3307 ; DOI : 10.4000/physio-geo.3307
- Chave S. (2002) - Contribution à la validation numérique de la cartographie hydrogéomorphologique, Géomorphologie, 4, pp. 297-306.
- Esposito C. (2011) - Crue du 15 juin 2010 dans le Var - Comparaison des limites des zones inondables et des zones inondées. Rapport 12/2011, CETE Méditerranée / DREAL PACA,
- Esposito C., Chave S., Ballais J.-L., Delorme-Laurent V. (2009) - Hydrogeomorphological mapping and recent floods in France - Proceeding of the Ninth Conference on the Mediterranean Coastal Environment, MEDCOAST 09, E. Ozhan (Editor), 10-14 November 2009, Sochi, Russia (http://www.medcoast.org.tr/publications/proceedings_09.html#vol1 )
- Esposito C. (2003) - Crues de septembre 2002 sur le bassin versant du Gardon, Etude comparative entre les limites de la cartographie hydrogéomorphologique et le relevé de la zone inondée, mémoire de DEA, université de Provence, Aix-en-Provence, 40 p.,
- Ministère de l'Equipement, des Transports et du Tourisme /Ministère de l'Environnement (1996) - Cartographie des zones inondables : approche hydrogéomophologique - Ed. Villes et Territoires, 100 p.
Note : d'autres personnes peuvent avoir contribué au contenu de cet article, [Consultez l'historique]. |
Note : d'autres personnes peuvent avoir contribué au contenu de cet article, [Consultez l'historique]. |
 S'abonner à un flux RSS
