Cartographie des zones inondables par approche hydrogéomorphologique/en
 Language: Language: |
Français • English |
Sommaire |
Introduction
Since the publication of the methodology guide in 1996, the method of mapping of floodplains using hydro-geomorphology has been essential to the creation of floodplain Atlas' and the Flood Hazard PPR maps. It has been used in projects concerning land use and development (PLU, SCOT ...).
This method allows for a good understanding of the natural and man-made elements elements of the valleys landscape, of the different parts of the alluvial plains and of the hydrodynamics of the streams. Its precision has been proved to be effective during the extraordinary floods in the Aude in November 1999, the Gard during September 2002 and the Var in June 2010.
Scientific Basis
The hydro-geomorphological approach is a geomorphological analysis of the alluvial plains.
Geomorphology is the science of describing and explaining continental and submarine landforms
By studying the formation of the landscape on a geological time-scale as well as the effects of climate change and the current morphogenic (je ne sais pas si ce mot a le meme sens en anglais) processes. This science provides a basis for the global understanding of the evolution of landscapes on different time-scales and sizes; It enables, for every studied landscape, the creation of a model of its evolution taking into account its geological and climatic history.
During the quaternary era, the current geological era which started 1,8 million years ago. The numerous climatic variations multiplied the amount of ENCAISSEMENT AND siltation phases making the alluvial sediments stratify or slide into one another. The lowest STRATA above the LIT MAJEUR FONCTIONEL (floodplain ?) is most commonly ascribed to the Würm (80 000 BC to 10 000 BC), the last ice age before the Holocene, the present era, during which took shape the present alluvial plains studied with the hydro-geomorphological approach.
Method of Analysis
Principe
Essentially the method revolves around the analysis of :
- the physical shape of the valley and the basic theoretic model taking into account its evolution in space and time.
- Information relative to the historic floods
- Land-use
- The man-made structures likely to affect the rivers hydraulic functioning, especially during a flood.
In order to make the model it is necessary to divide the drainage basin into its most essential and important elements:
- Geographic units (areas) reflecting the hydraulic functioning of the river in its different regimes :
- the river banks and alluvial terraces forming the entrenchement
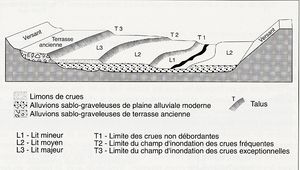
- the alluvial plain separated into minor and major riverbeds.
- Precise boundaries separating those units and enabling the mapping of them : the cracks caused by the valleys erosion.
- Within the floodplain secondary morphological structures that can have a major impact on the water flow (natural or man-made channels, fluvial annexes, shape of the ground .....)
The floodplain is the area which can be flooded, the river leaves identifiable morphological traces on the valley allowing us to delineate the floodplain. The floodplain can be separated into zones according to the likelihood of a flood and the impact one would have (figure 1).
Application
This type of study makes use of: :
- Existing documents
- Scientific Maps : geological and (seldom) geomorphological and pedological.
- Topographic maps, IGN has maps of France at a 1/10 000 scale
- The interpretation of stereo imagery, often multiple sets of pictures enables can be very interesting ( more precise or evolution over a period) A specialist might be required in difficult situations.
- Field work, observations are necessary to verify and complete the information obtained with the pictures (ex: in case of dense foliage) . It is possibles to find traces of the previous floods and get information from the locals.
Hydrogeomorphological mapping
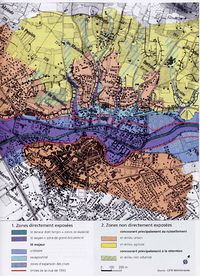
After the phase of analysis and interpretation a map can be made. It is usually 1/10 000 or 1/25 000 on a SCAN 25. This map will display:
- The basic structure: the relief delineating the alluvial plain and the hydrographic network
- An interpretation of the hydro-geomorphological units:
- Boundaries of the classified riverbeds : minor, middle and major.
The required precision demands an adapted key: factors with an impact on hydrodynamics will be on the map.
Some structural elements of the effective alluvial plain may be shrouded or hidden for a multitude of reasons (urbanisation, agriculture ...) The components of the alluvial system will be represented very precisely on the map after having been verified on the field. The elevation af geographic units will be specified as well. In case the boundary between two units is uncertain or gradual it will be represented by a dotted line.
Comparison between theoric results and historic floods
The historic floods
Three rivers in the south of France can be studied to compare the actual flood and the prediction made using the Hydro-geomorphological approach :
- November 1999 int the Aude,
- September 2002 in the Gard,
- June 2010 in the Var.
The method
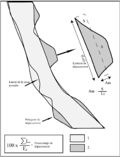
This numerical method comes from three publications (one by Chave in 2002 and two by Esposito in 2003 and 2011). The basic numeric data is a vector layer which can be assimilated with multiple straight lines. When the flooded zone exceeds the predicted floodplain it is represented by an excess polygon. It is possible to delineate all of those and calculate their surface using the MapInfo program. After that the program shall determine the “LINEAIRE” : the length of the line of contact between the excess polygon and the predicted floodplain. The magnitude of the excess flooding still has to be characterised; it is defined as such : If you were to assimilate the polygon with a rectangle of equal surface and having the linear as a side. (S: surface of the polygon, L : length of the Linear, Am: average Magnitude) L*AM = S
The, numeric, threshold above which an Am can be considered significant can be defines as the sum of all imprecisions, starting with the imperfections of the field data, the interpretation and the approximation into polygons. If the average magnitude of the excess flooding if superior to this threshold we shall consider the polygon to hold some interesting interesting information. After analysing all the steps to making this map, this threshold was fixed at 25m
Les résultats
Dans l'Aude et le Gard, les traitements graphiques, appliqués aux vingt-sept cours d’eau étudiés permettent de mettre en évidence la très large propagation des eaux de ces deux crues rares à exceptionnelles à l’intérieur des limites de leur plaine alluviale fonctionnelle. Cette première conclusion repose sur les valeurs de linéaires obtenues pour chacune des trois situations constatées après le passage de la crue : les cas de dépassement, les cas de remplissage et les cas de non-remplissage. La première de ces catégories représente les situations pour lesquelles la limite de la zone inondée se situe au-delà de la plaine alluviale fonctionnelle du cours d'eau. Le taux moyen de ce linéaire de dépassement représente 12,5 % du linéaire de l’enveloppe géomorphologique audoise et moins de 9 % de celui de l’enveloppe gardoise. Ces dépassements apparaissent comme ponctuels puisque 51 de ces situations ont été inventoriées dans l’Aude et 72 dans le Gard. Globalement, ils se caractérisent également comme des dépassements limités puisque seulement 5 % de ce linéaire montre une amplitude moyenne supérieure à 60 mètres.
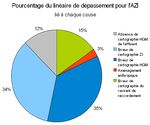
Dans le Var, Pour les débordements de la zone inondée sur les limites de la zone inondable définie par approche hydrogéomorphologique, il a fallu analyser 21 polygones de dépassements. Pour chaque polygone, nous avons pu définir une cause de débordement. Au total, cinq causes ont été mises en évidence sur les 21 polygones. « Absence de cartographie HGM de l'affluent » signifie que les dépassements sont liés au fait qu'il n'y a pas de cartographie de la zone inondable par approche hydrogéomorphologique dans les secteurs où une zone inondée a été définie. « Erreur de cartographie ZI » signifie que nous avons observé une erreur sur la cartographie de la zone inondée lors de la crue de juin 2010.« Erreur de cartographie HGM » signale une erreur de la cartographie hydrogéomorphologique. « Aménagement anthropique » montre que le dépassement est dû à la présence d'aménagements. « Erreur de cartographie du versant de raccordement » est présent quand la zone inondée s'étale au-delà de la partie externe du lit majeur dans une forme concavo-convexe. Nous avons comparé 305 km d'enveloppe hydrogéomorphologique à 338 km d'enveloppe de zone inondée. Sur les 21 polygones, 3 sont dus à des absences de cartographie hydrogéomorphologique dans les affluents. Mais l'élément essentiellement est la forte proportion des erreurs de cartographies (au total 15 polygones). La présence d'un aménagement anthropique (voie SNCF) a créé un dépassement. Plus convaincante, l'analyse des linéaires de dépassement montre que sur les 11311 m de linéaire de dépassement, 7900 m sont dûs aux erreurs cartographiques hydrogéomorphologiques et de la zone inondée. Pour les dépassements liés au versant de raccordement, c'est un élément difficile à expliquer étant donné que la cartographie de cette limite concavo-convexe n'est pas facile à définir à l'échelle du 1/25.000. Ceci représente 15 % soit 1718 m sur les 11311 liés à l'ensemble des dépassements. C'est donc près de 84% du linéaire de dépassement qui est dû à des erreurs de cartographie. Sur cette thématique d'Atlas des Zones Inondables, nous disposions d'un linéaire d'enveloppe hydrogéomorphologique de plus de 300 km. Cette enveloppe a été dépassée par la crue de juin 2010 sur plusieurs secteurs totalisant un linéaire de 11 km c'est-à-dire 4%. Cela veut dire que plus de 96% de la crue ont été contenus dans l'enveloppe hydrogéomorphologique.
Sources
- Chave S. (2002) - Contribution à la validation numérique de la cartographie hydrogéomorphologique, Géomorphologie, 4, pp. 297-306.
- Esposito C. (2011) - Crue du 15 juin 2010 dans le Var - Comparaison des limites des zones inondables et des zones inondées. Rapport 12/2011, CETE Méditerranée / DREAL PACA,
- Esposito C., Chave S., Ballais J.-L., Delorme-Laurent V. (2009) - Hydrogeomorphological mapping and recent floods in France - Proceeding of the Ninth Conference on the Mediterranean Coastal Environment, MEDCOAST 09, E. Ozhan (Editor), 10-14 November 2009, Sochi, Russia (http://www.medcoast.org.tr/publications/proceedings_09.html#vol1 )
- Esposito C. (2003) - Crues de septembre 2002 sur le bassin versant du Gardon, Etude comparative entre les limites de la cartographie hydrogéomorphologique et le relevé de la zone inondée, mémoire de DEA, université de Provence, Aix-en-Provence, 40 p.,
- Ministère de l'Equipement, des Transports et du Tourisme /Ministère de l'Environnement (1996) - Cartographie des zones inondables : approche hydrogéomophologique - Ed. Villes et Territoires, 100 p.
Note : d'autres personnes peuvent avoir contribué au contenu de cet article, [Consultez l'historique]. |
Note : d'autres personnes peuvent avoir contribué au contenu de cet article, [Consultez l'historique]. |
Liens :
 S'abonner à un flux RSS


